1 About the class
1.1 Objectives of the class
The goal of this class is that at the end, the students are able to:
- Treat their data with the free and open source language R, i.e.:
- Read, browse, manipulate and plot their data
- Model or simulate their data
- Make automatic reporting through Rmarkdown or Quarto
- Build a graphical interface with Shiny to interact with their data and output something (a value, a pdf report, a graph…)
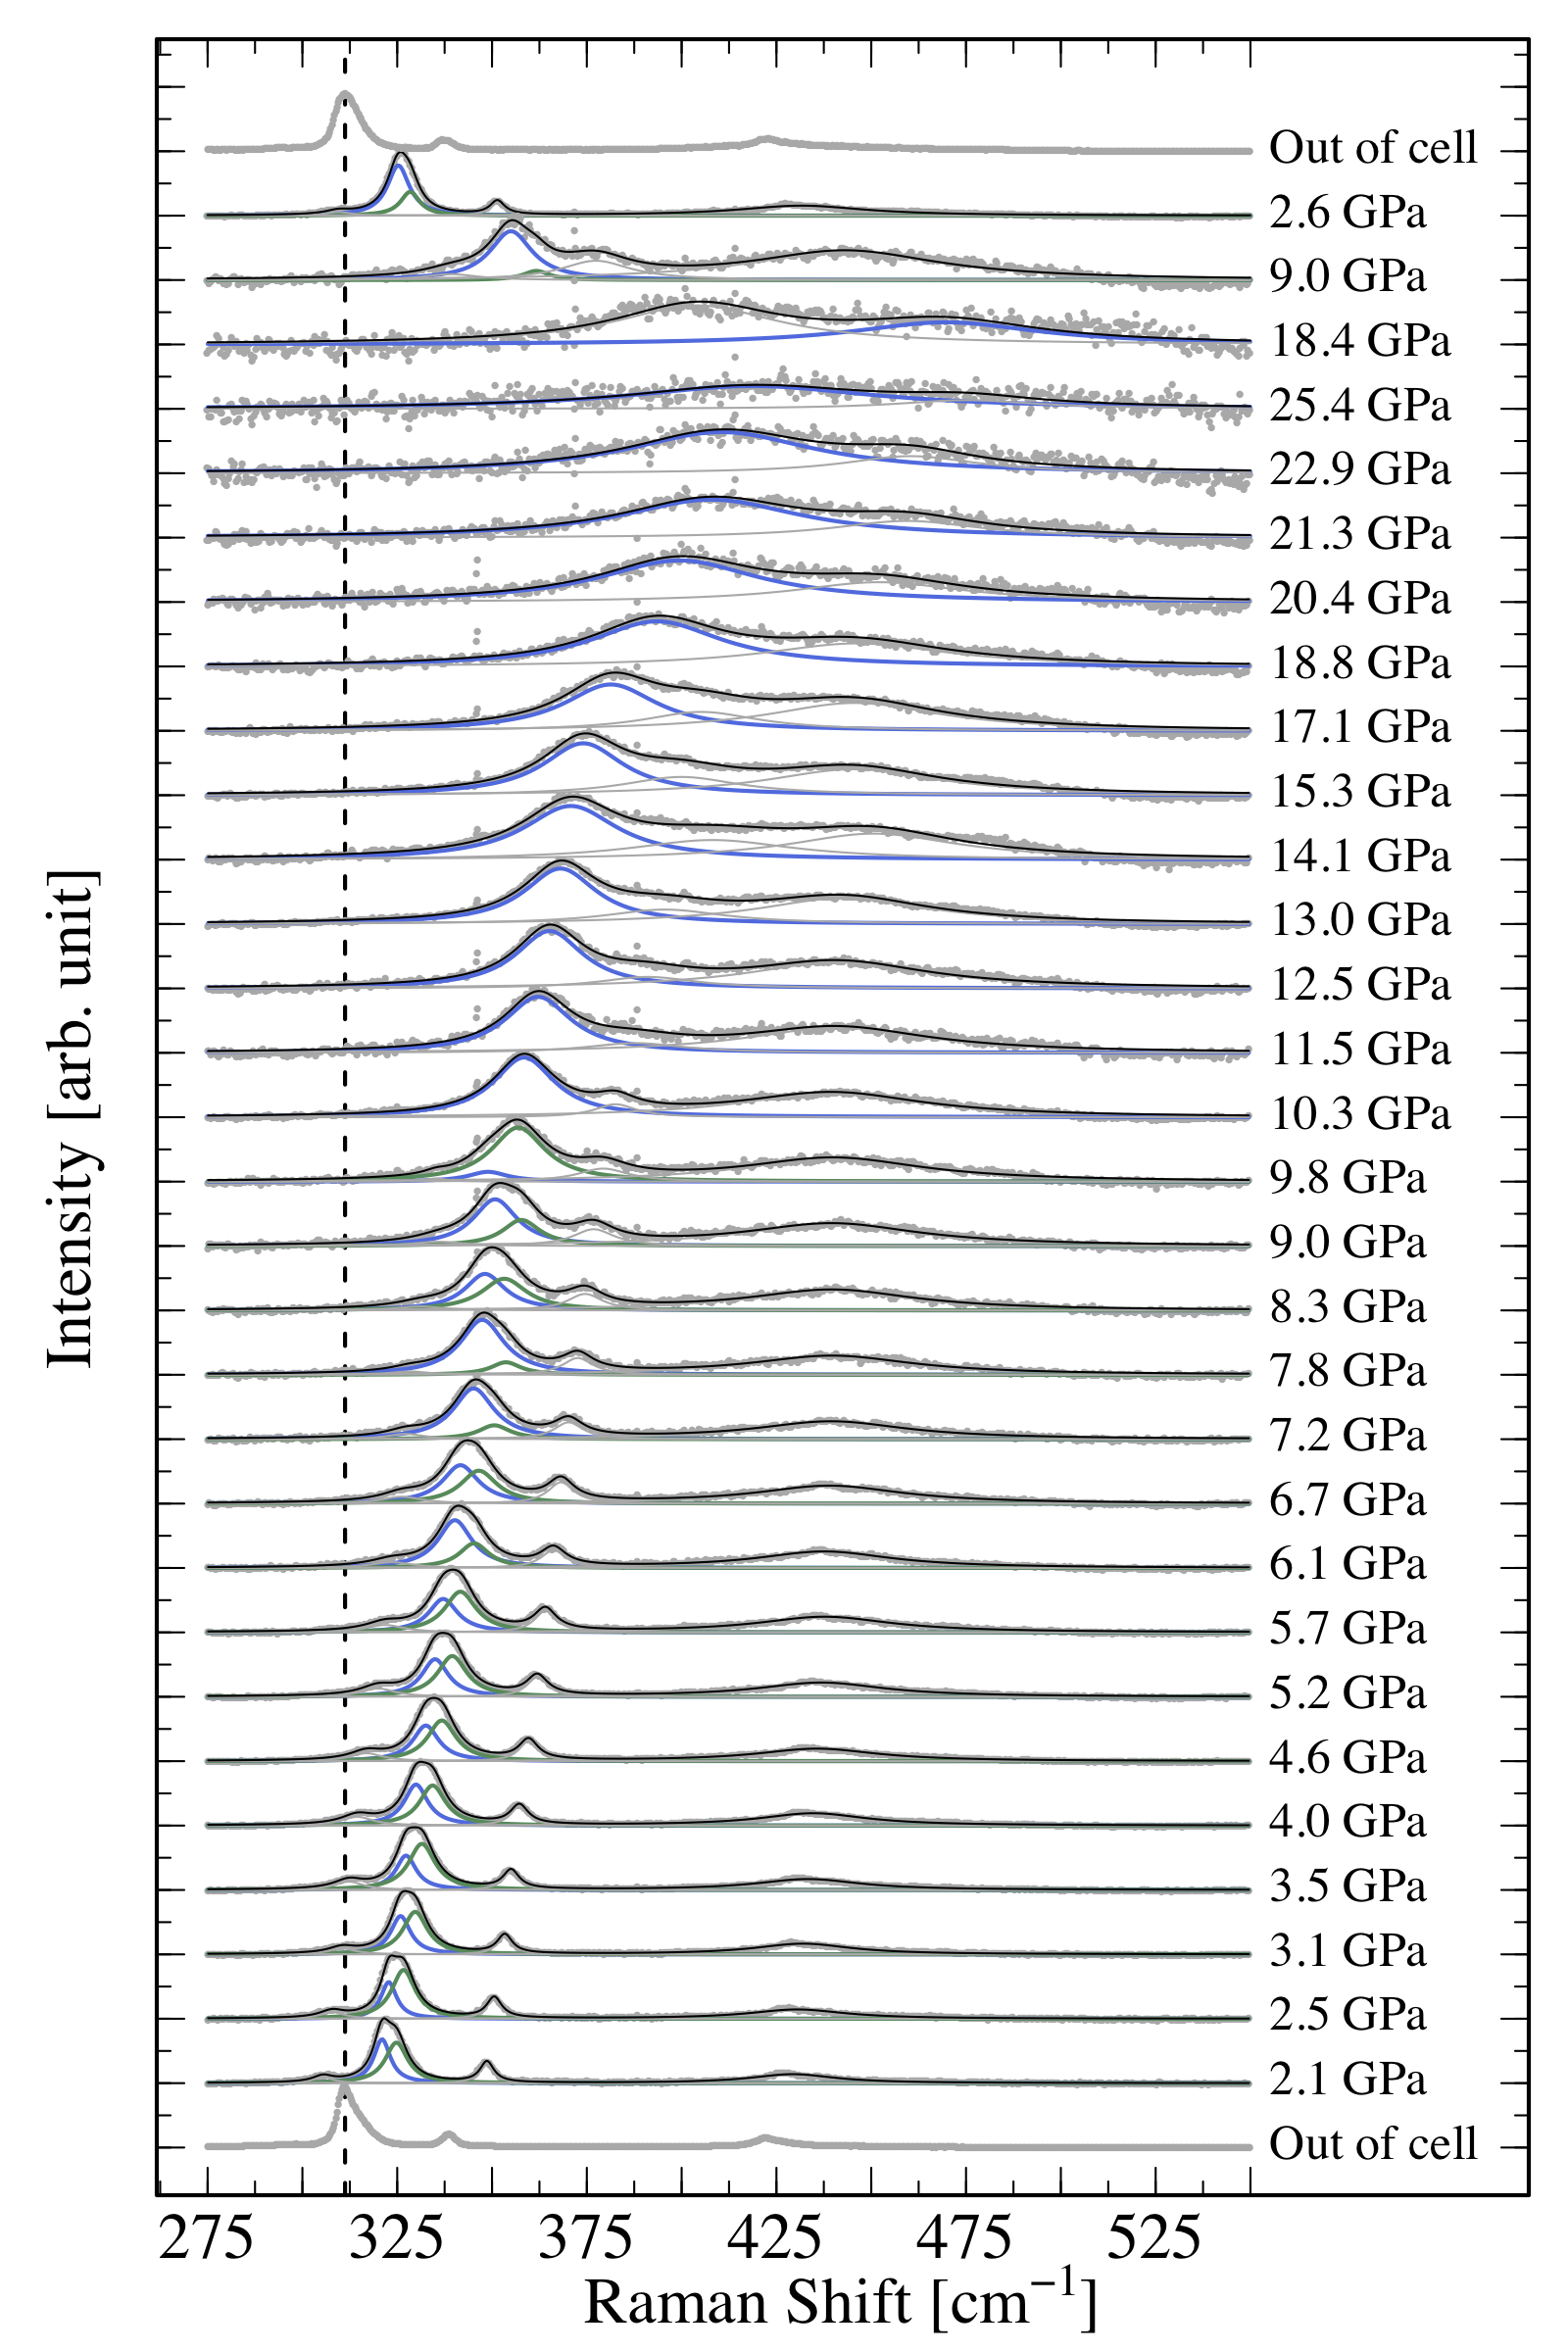
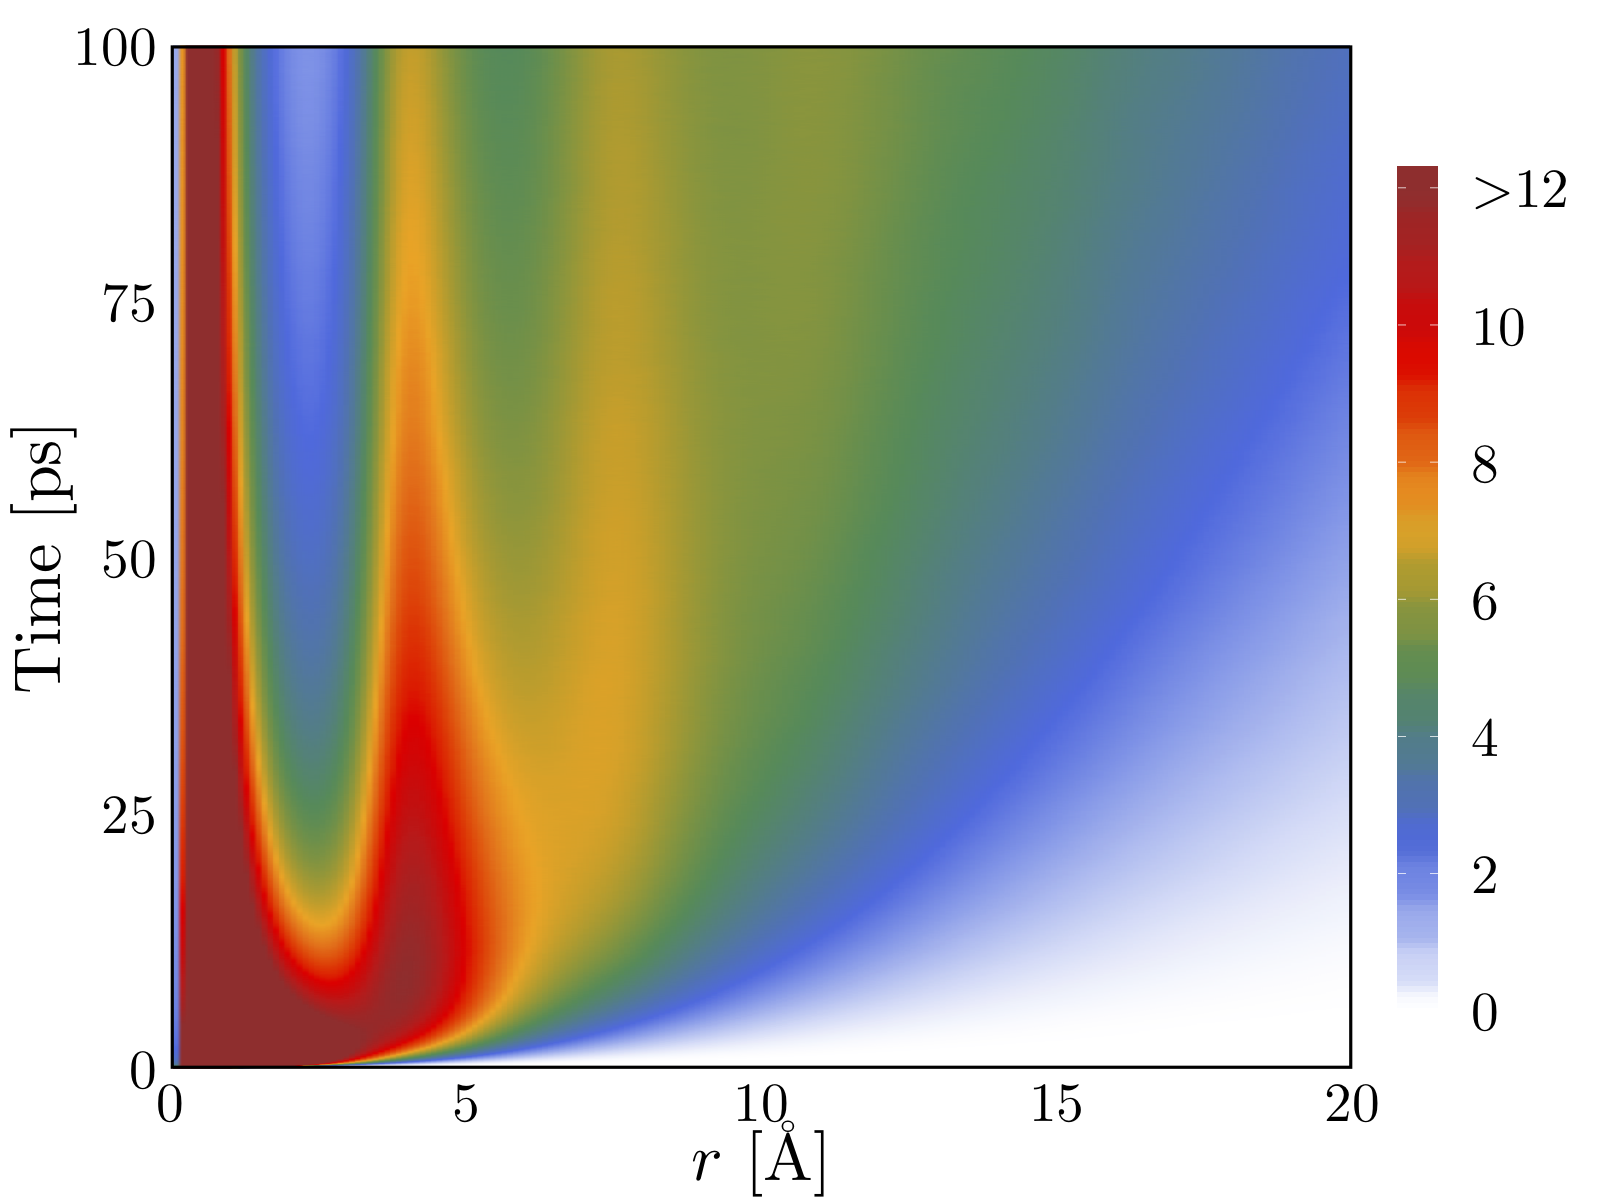
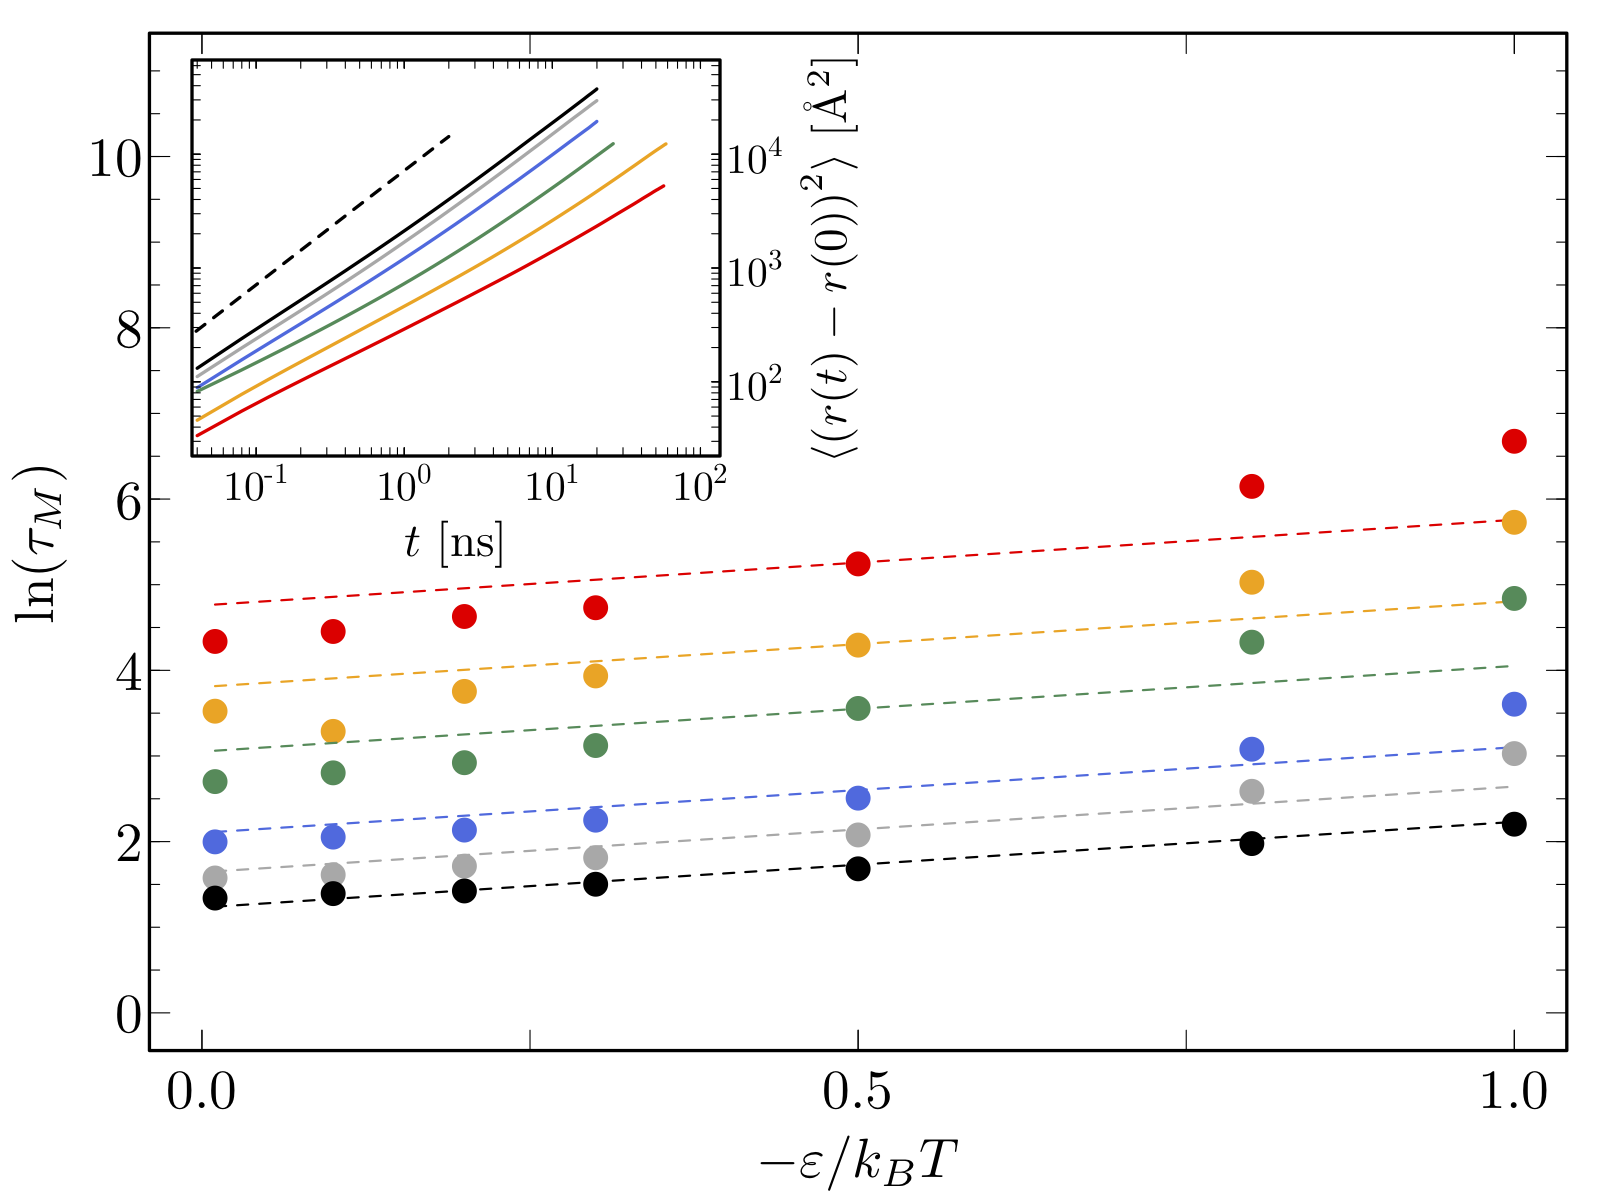
What you will learn here will be useful in any scientific domain. The examples in this course are however mainly coming from the type of data you might encounter in Materials Science because, well, it’s what I have on hand…
1.2 Prerequisites
- Coding skills: none expected.
- The students should come with a laptop with admin rights (i.e. you should be able to install stuff).
1.3 Motivations
1.3.1 Reproducible data treatment: why it matters
Here is an introduction from the Wikipedia page on reproducible research:
In 2016, Nature conducted a survey of 1576 researchers who took a brief online questionnaire on reproducibility in research. According to the survey, more than 70% of researchers have tried and failed to reproduce another scientist’s experiments, and more than half have failed to reproduce their own experiments. […] Although 52% of those surveyed agree there is a significant ‘crisis’ of reproducibility, less than 31% think failure to reproduce published results means the result is probably wrong, and most say they still trust the published literature.1
Replicability and reproducibility are some of the keys to scientific integrity. Establishing a workflow in which your data are always treated in the same manner is a necessity, because it is a way to:
- Minimize errors inherent to human manipulation
- Keep track of all the treatments you perform on your data and document your methodology: this allows others to reproduce your data, but also yourself.
- Help you to make sense of all your data, and avoid disregarding some data (hence help you keep your scientific integrity)
- Gain tremendous amounts of time
It is the objective of this class to provide you the tools necessary to work within this philosophy.
1.3.2 Why with R and not python?
The eternal question… R was originally designed by statisticians for statisticians and it might still suffers from this “statistics only” label that sticks to it.
Python is a wide spectrum programming language with very efficient numerical libraries used in the computer science community.
R is focused on data treatment, statistics and representation. In R, the object is the data, and base R allows you to read, treat, fit and plot your data very easily – although you will still most certainly need additional packages.
So with python, you can do everything, including treating and analyzing scientific data – with the right packages. With R, you can do less but do very well what you do, and in my opinion more seamlessly (probably because I learned and used R for years before starting with python…). In my opinion, this xkcd comic about python environment is only slightly exaggerated… while for R, installation and maintenance is sooooo easy in comparison…
Each language has his own strengths and weaknesses. To my tastes, I would say that python and R compare like that (although a pythonist would probably say the opposite):
| R | Python | |
|---|---|---|
| Free and open source | ✔✔✔ | ✔✔✔ |
| IDE | ✔✔✔ | ✔✔✔ |
| Large code repository | ✔✔✔ | ✔✔✔ |
| Large community | ✔✔✔ | ✔✔✔ |
| Notebooks | ✔✔✔ | ✔✔✔ |
| Machine Learning | ✔✔✔ | ✔✔✔ |
| Performances | ✔✔ | ✔✔✔ |
| Ease of installation and maintenance | ✔✔✔ | ✔ |
| Data visualization | ✔✔✔ | ✔ |
| Statistical analysis | ✔✔✔ | ✔ |
| Multi-purpose | ✔ | ✔✔✔ |
| Syntax, productivity, flexibility | ✔✔✔ | ✔✔✔ |
| Rmarkdown | ✔✔✔✔✔ | ✔ |
| Quarto | ✔✔✔✔✔ | ✔✔✔✔✔ |
Well, it’s all very subjective, really. In the end, I still use both languages, each one for a different purpose:
- Let’s say I want to produce an initial atomic configuration for a molecular dynamics simulation, or read a molecular dynamics trajectory and compute some quantities such as a pair correlation or a mean square displacement, or perform some image-based machine learning: python (or even C, if I need to treat large trajectories).
- Now if I want to make sense of some experimental measurements or results of simulations, do some fits and produce publication-quality graphs or experimental reports: R.
Both languages are great and being able to use both is the best thing that can happen to you (relatively speaking) – especially since you can combine them in Rmarkdown using the reticulate package, which we will see later in this class.
So, since my goal is to provide you with tools for seamlessly read, make sense, and plot your data in the reproducible science philosophy, let’s go with R. Also, R has a great IDE (Rstudio) that really eases working with data and code. Such a nice IDE is still lacking for python.
1.4 Further reading
This class is indented to provide the students with the tools to handle themselves with R, Rmarkdown and Shiny, and not to provide an extensive review of everything that is possible with R. To go further:
-
R
- R manual on CRAN
- Some cheatsheets
- The tidyverse website
- Tibbles.
- Tidy your data
- Tips to improve your code
-
Plotting
- The R Graph Gallery
- The R Graph Cookbook
- The ggplot cheatsheet
- Another one
- Another one quite extensive
- Another one
-
Rmarkdown
- Rmarkdown complete guide
- Rmarkdown cheatsheet
- Rmarkdown cookbook
- Rmarkdown code chunks
- Rmarkdown mixing languages
-
Shiny
- The Shiny cheatsheet
- Guide to application layout
- The Shiny Gallery: find what you want to do and adapt it to your needs
- The official Shiny video tutorial
- And as always, if you have a question, Google is your friend!


